.png)
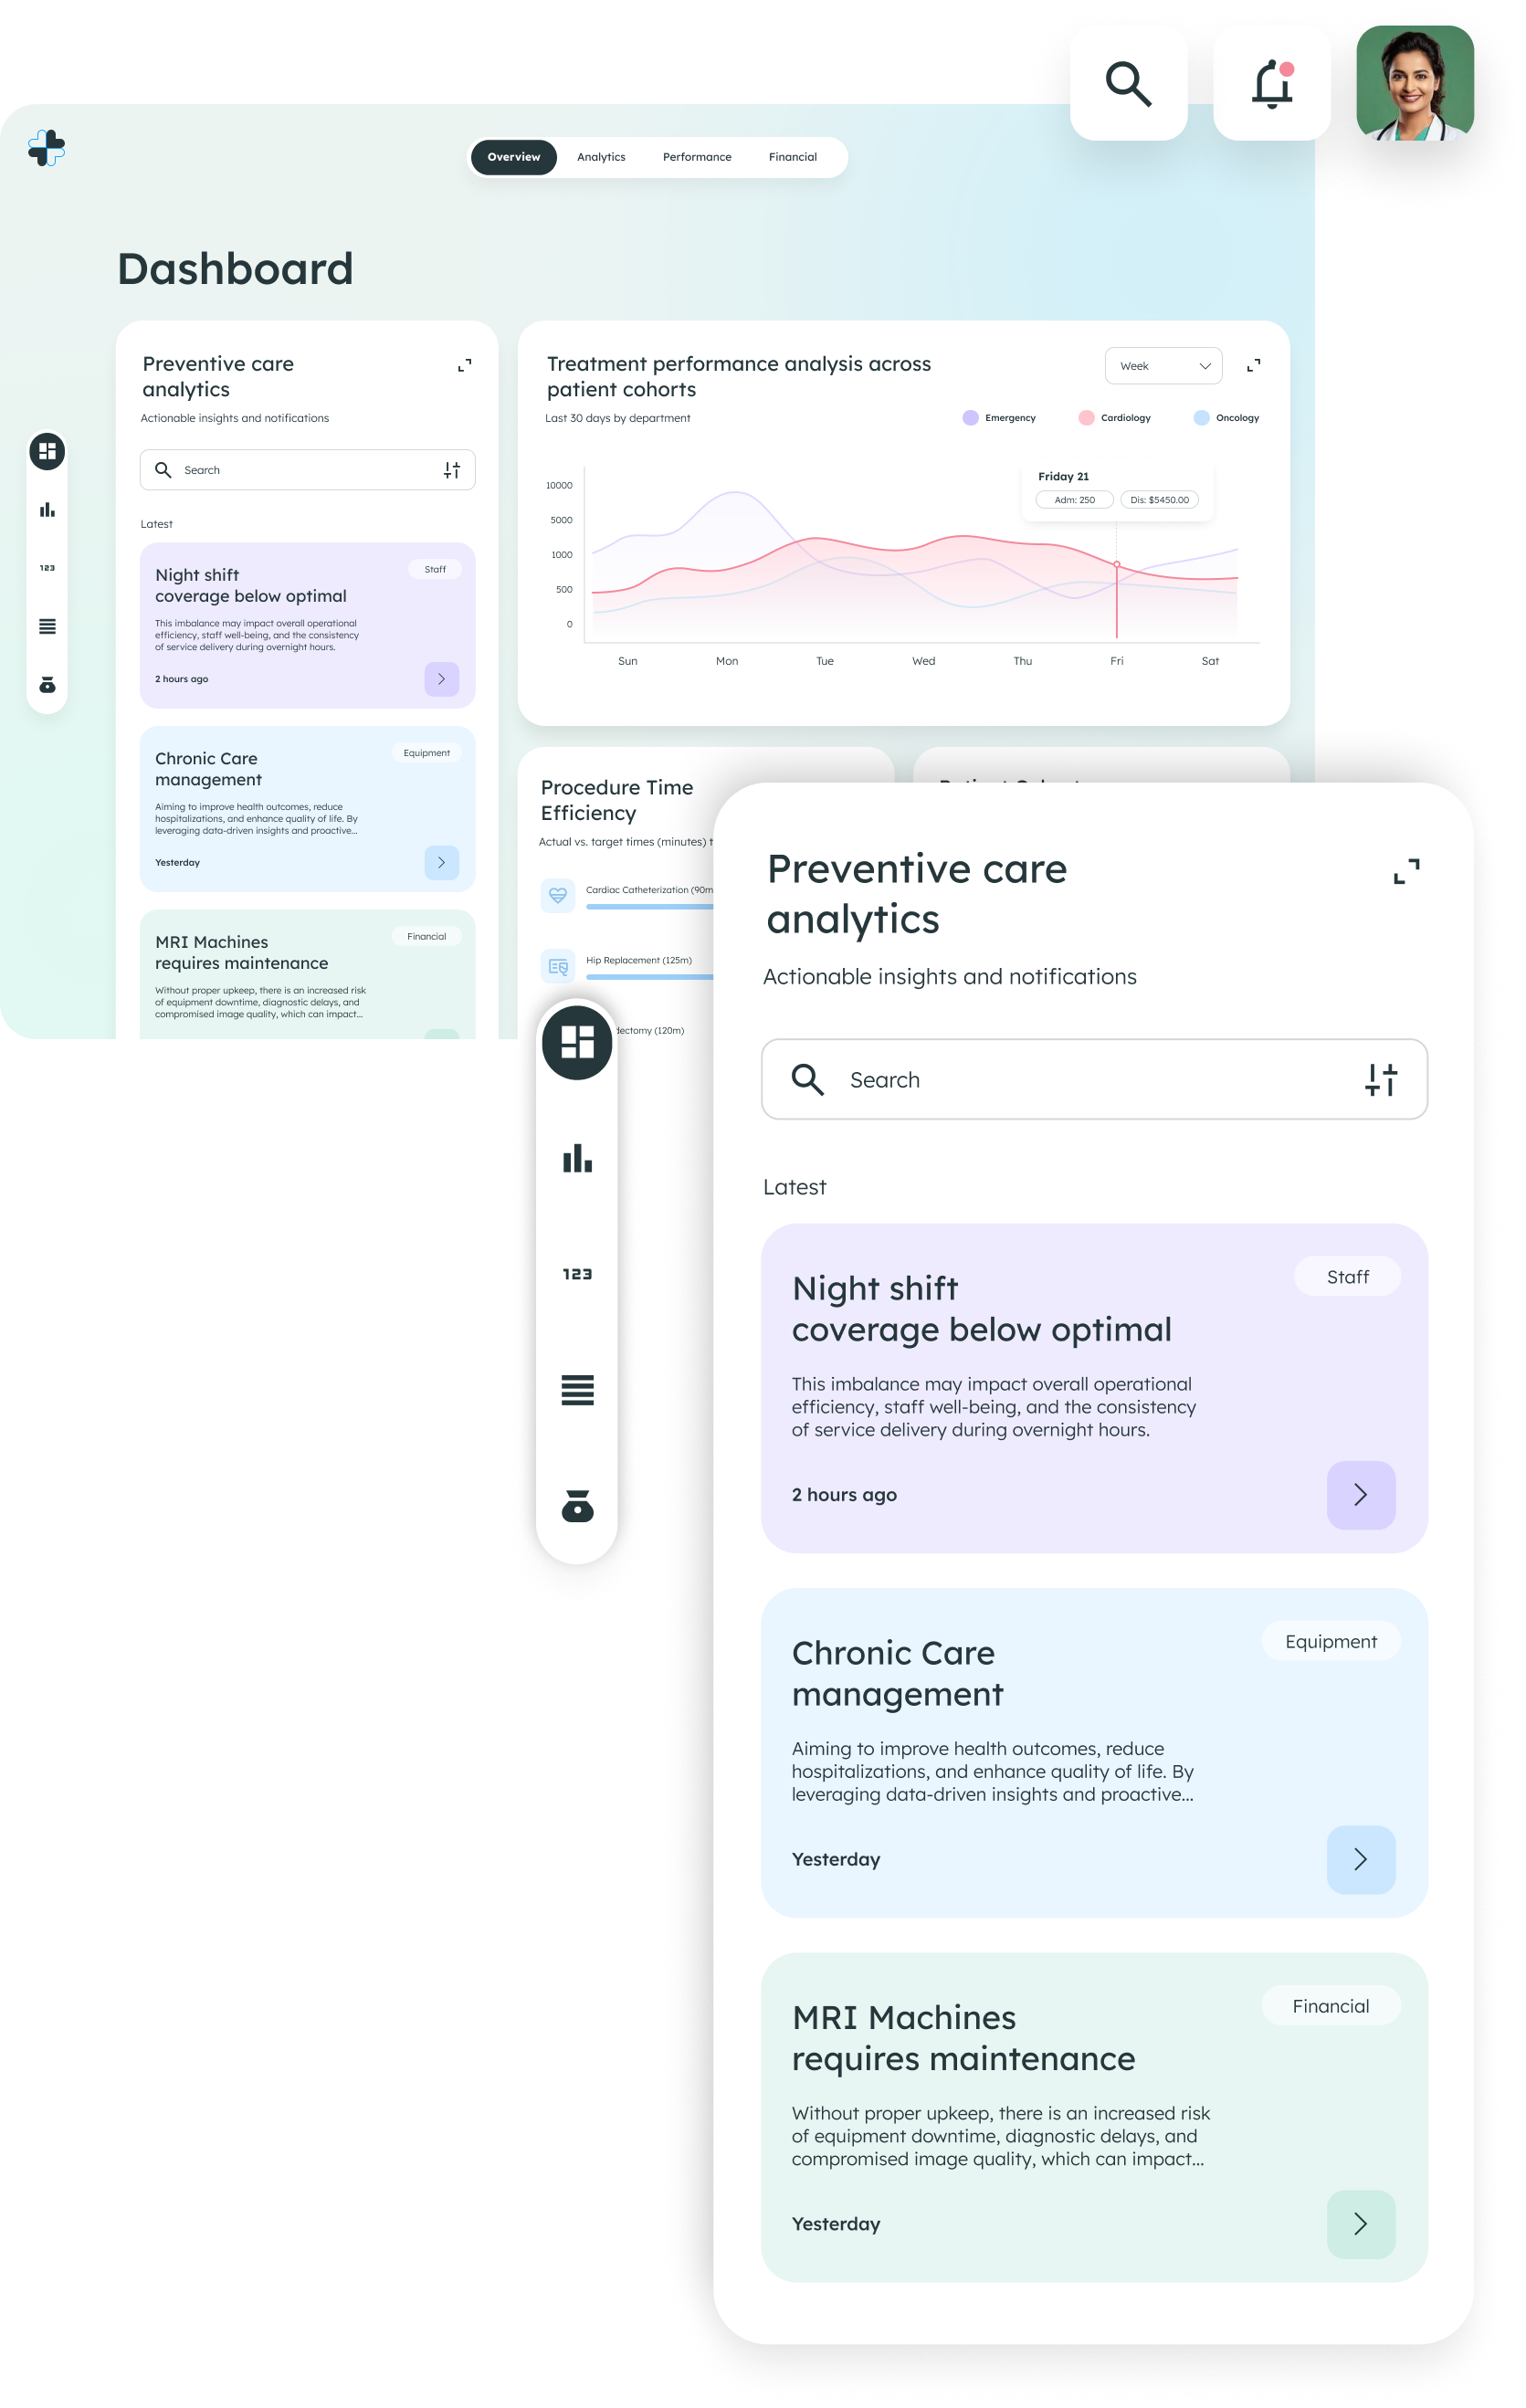
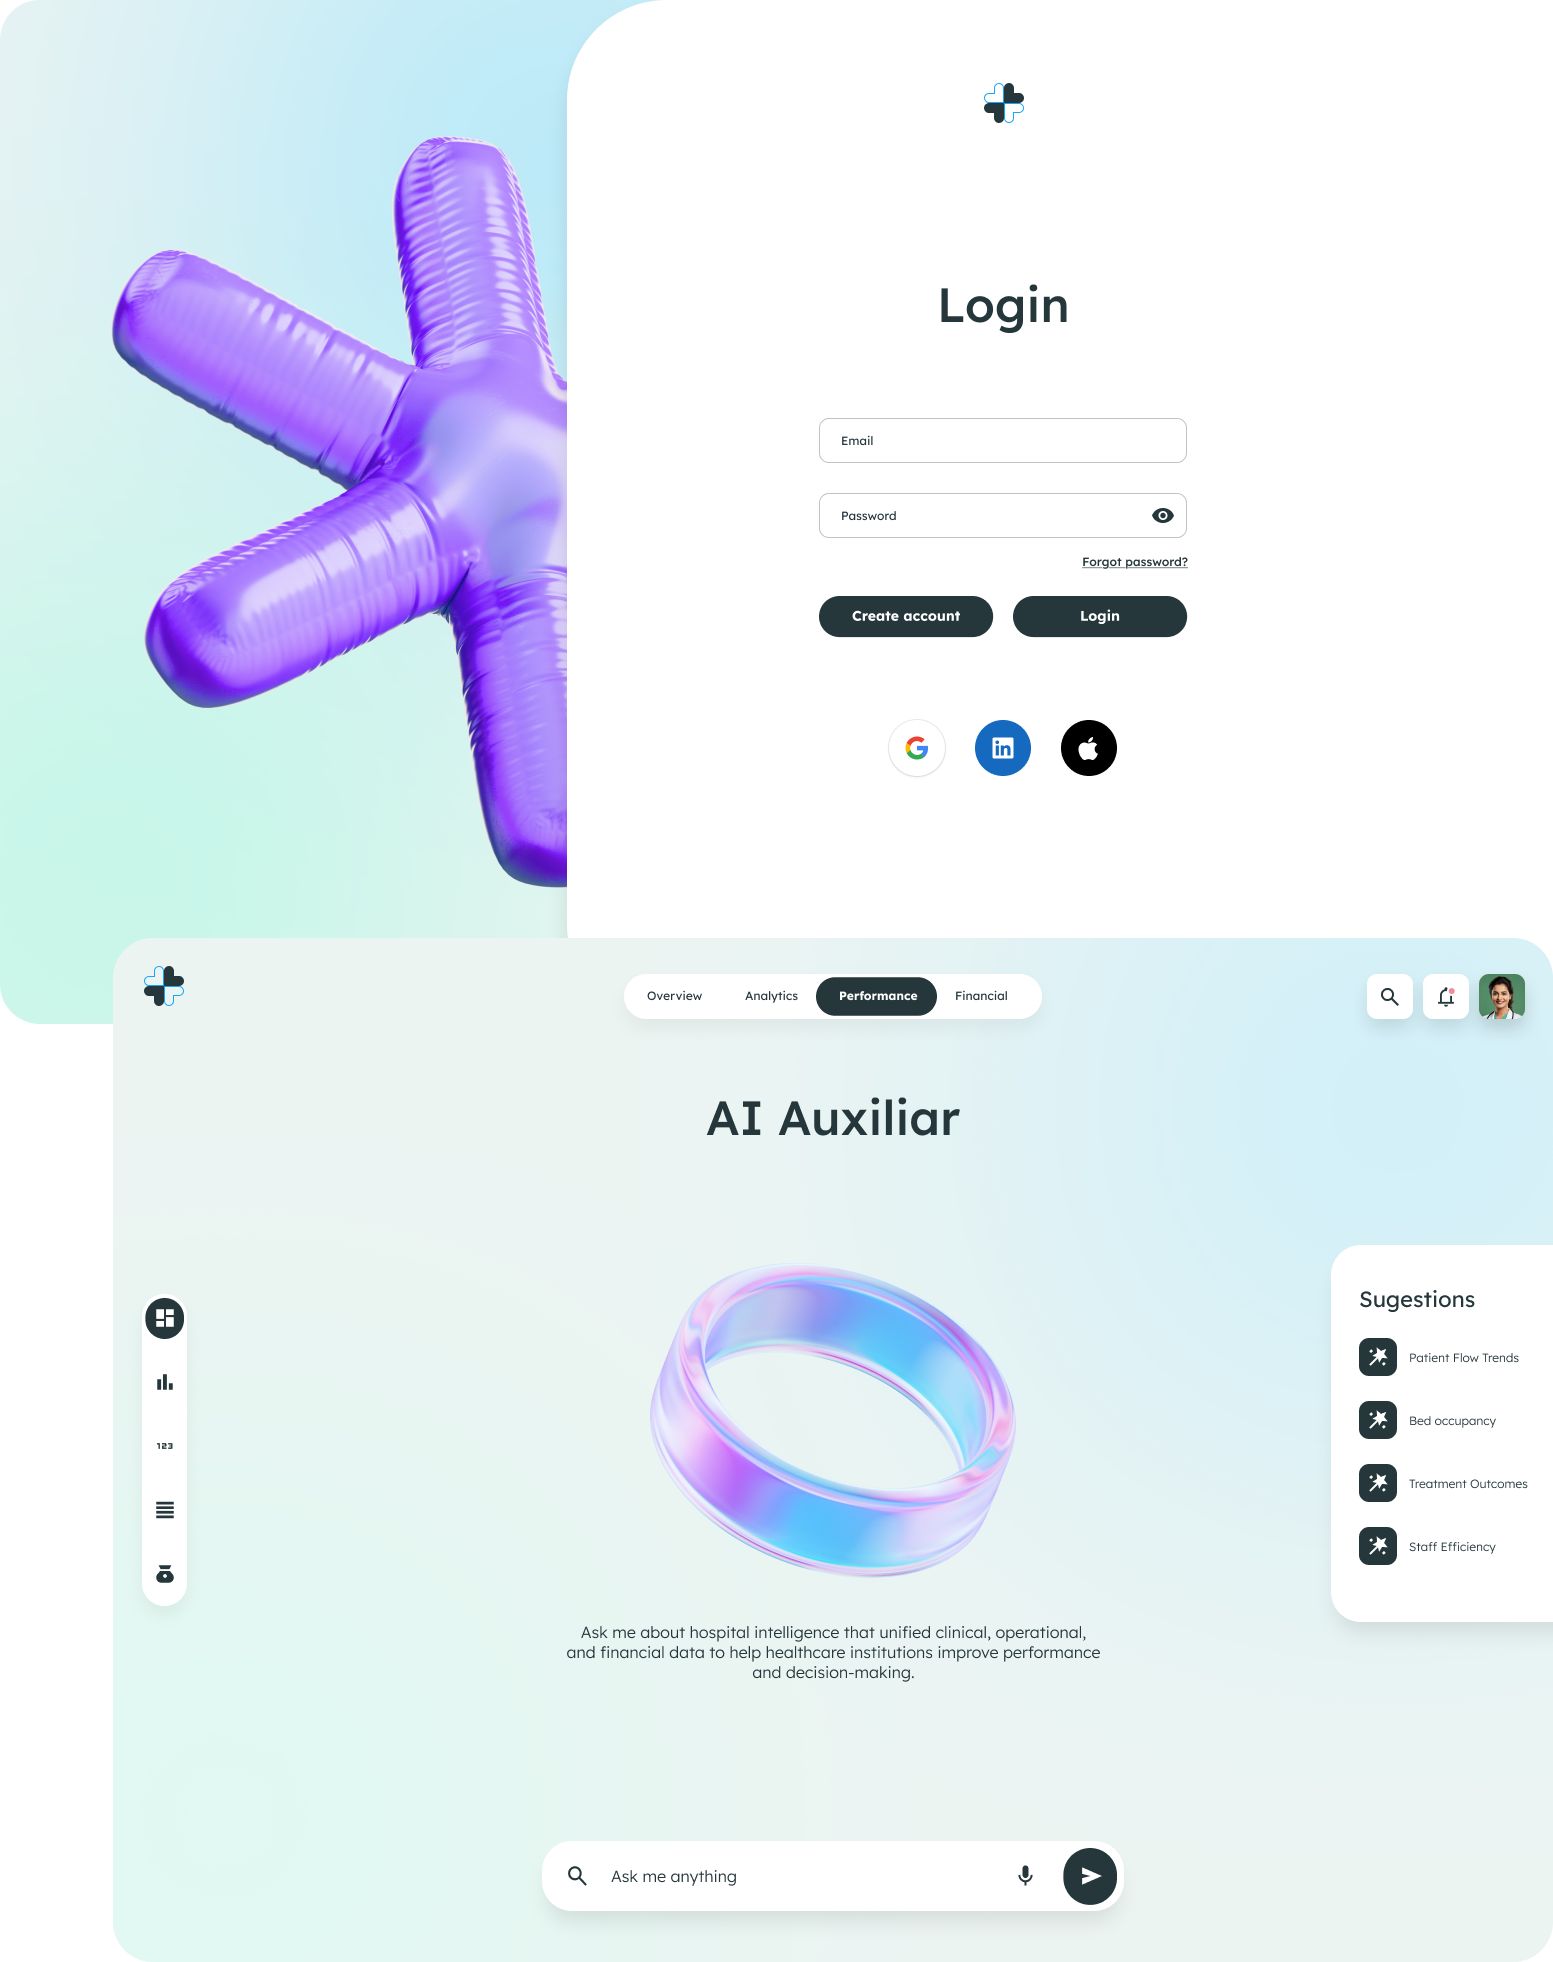
Foonkie Monkey developed an AI-driven hospital intelligence platform that unified clinical, operational, and financial data to help healthcare institutions improve performance and decision-making.
The system integrated Electronic Health Records (EHR), operational metrics, and financial data into a centralized analytics platform operating under HIPAA-compliant infrastructure.
Hospitals generate massive volumes of data across disconnected systems, including EHR platforms, billing systems, operational dashboards, and equipment monitoring tools.
Because these systems rarely communicate effectively, hospital leadership often lacks a unified view of institutional performance.
The challenge was to build an AI-powered platform capable of integrating fragmented data sources and transforming them into actionable institutional intelligence.
Foonkie Monkey designed a healthcare analytics platform capable of analyzing hospital performance across multiple operational dimensions.The system provided:
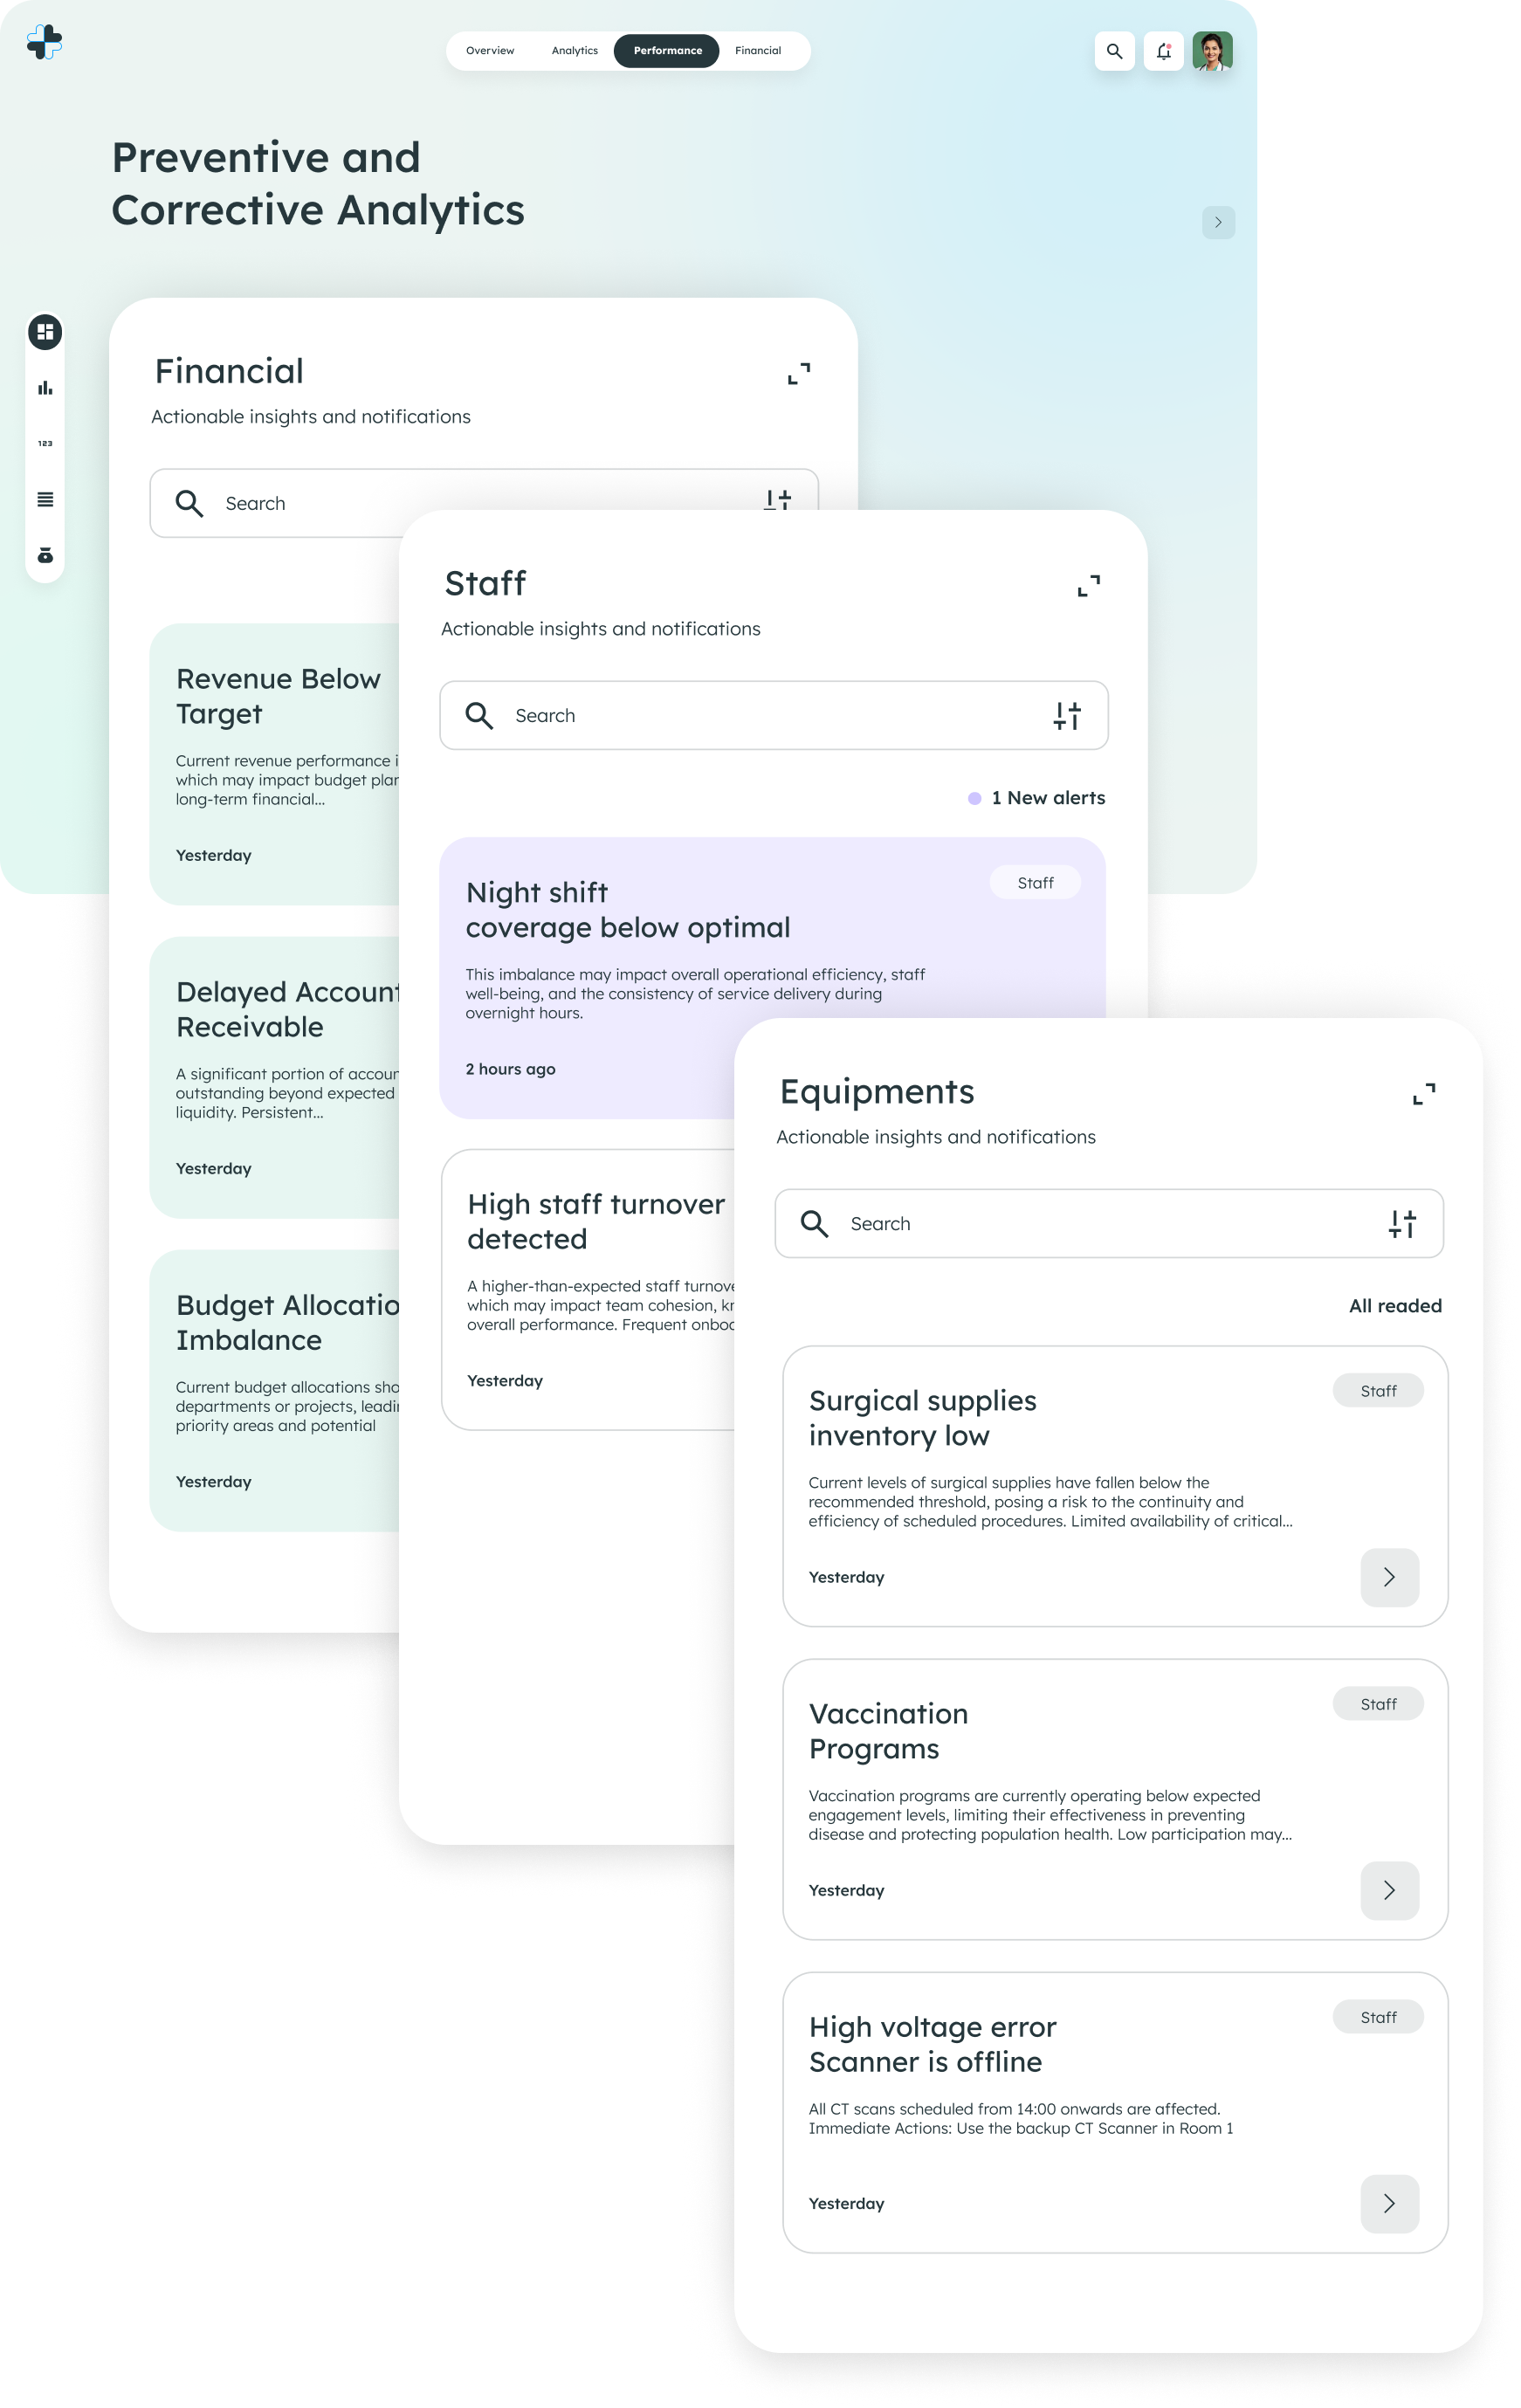
• Preventive vs. corrective care analytics
• Treatment performance analysis across patient cohorts
• Staff workflow efficiency insights
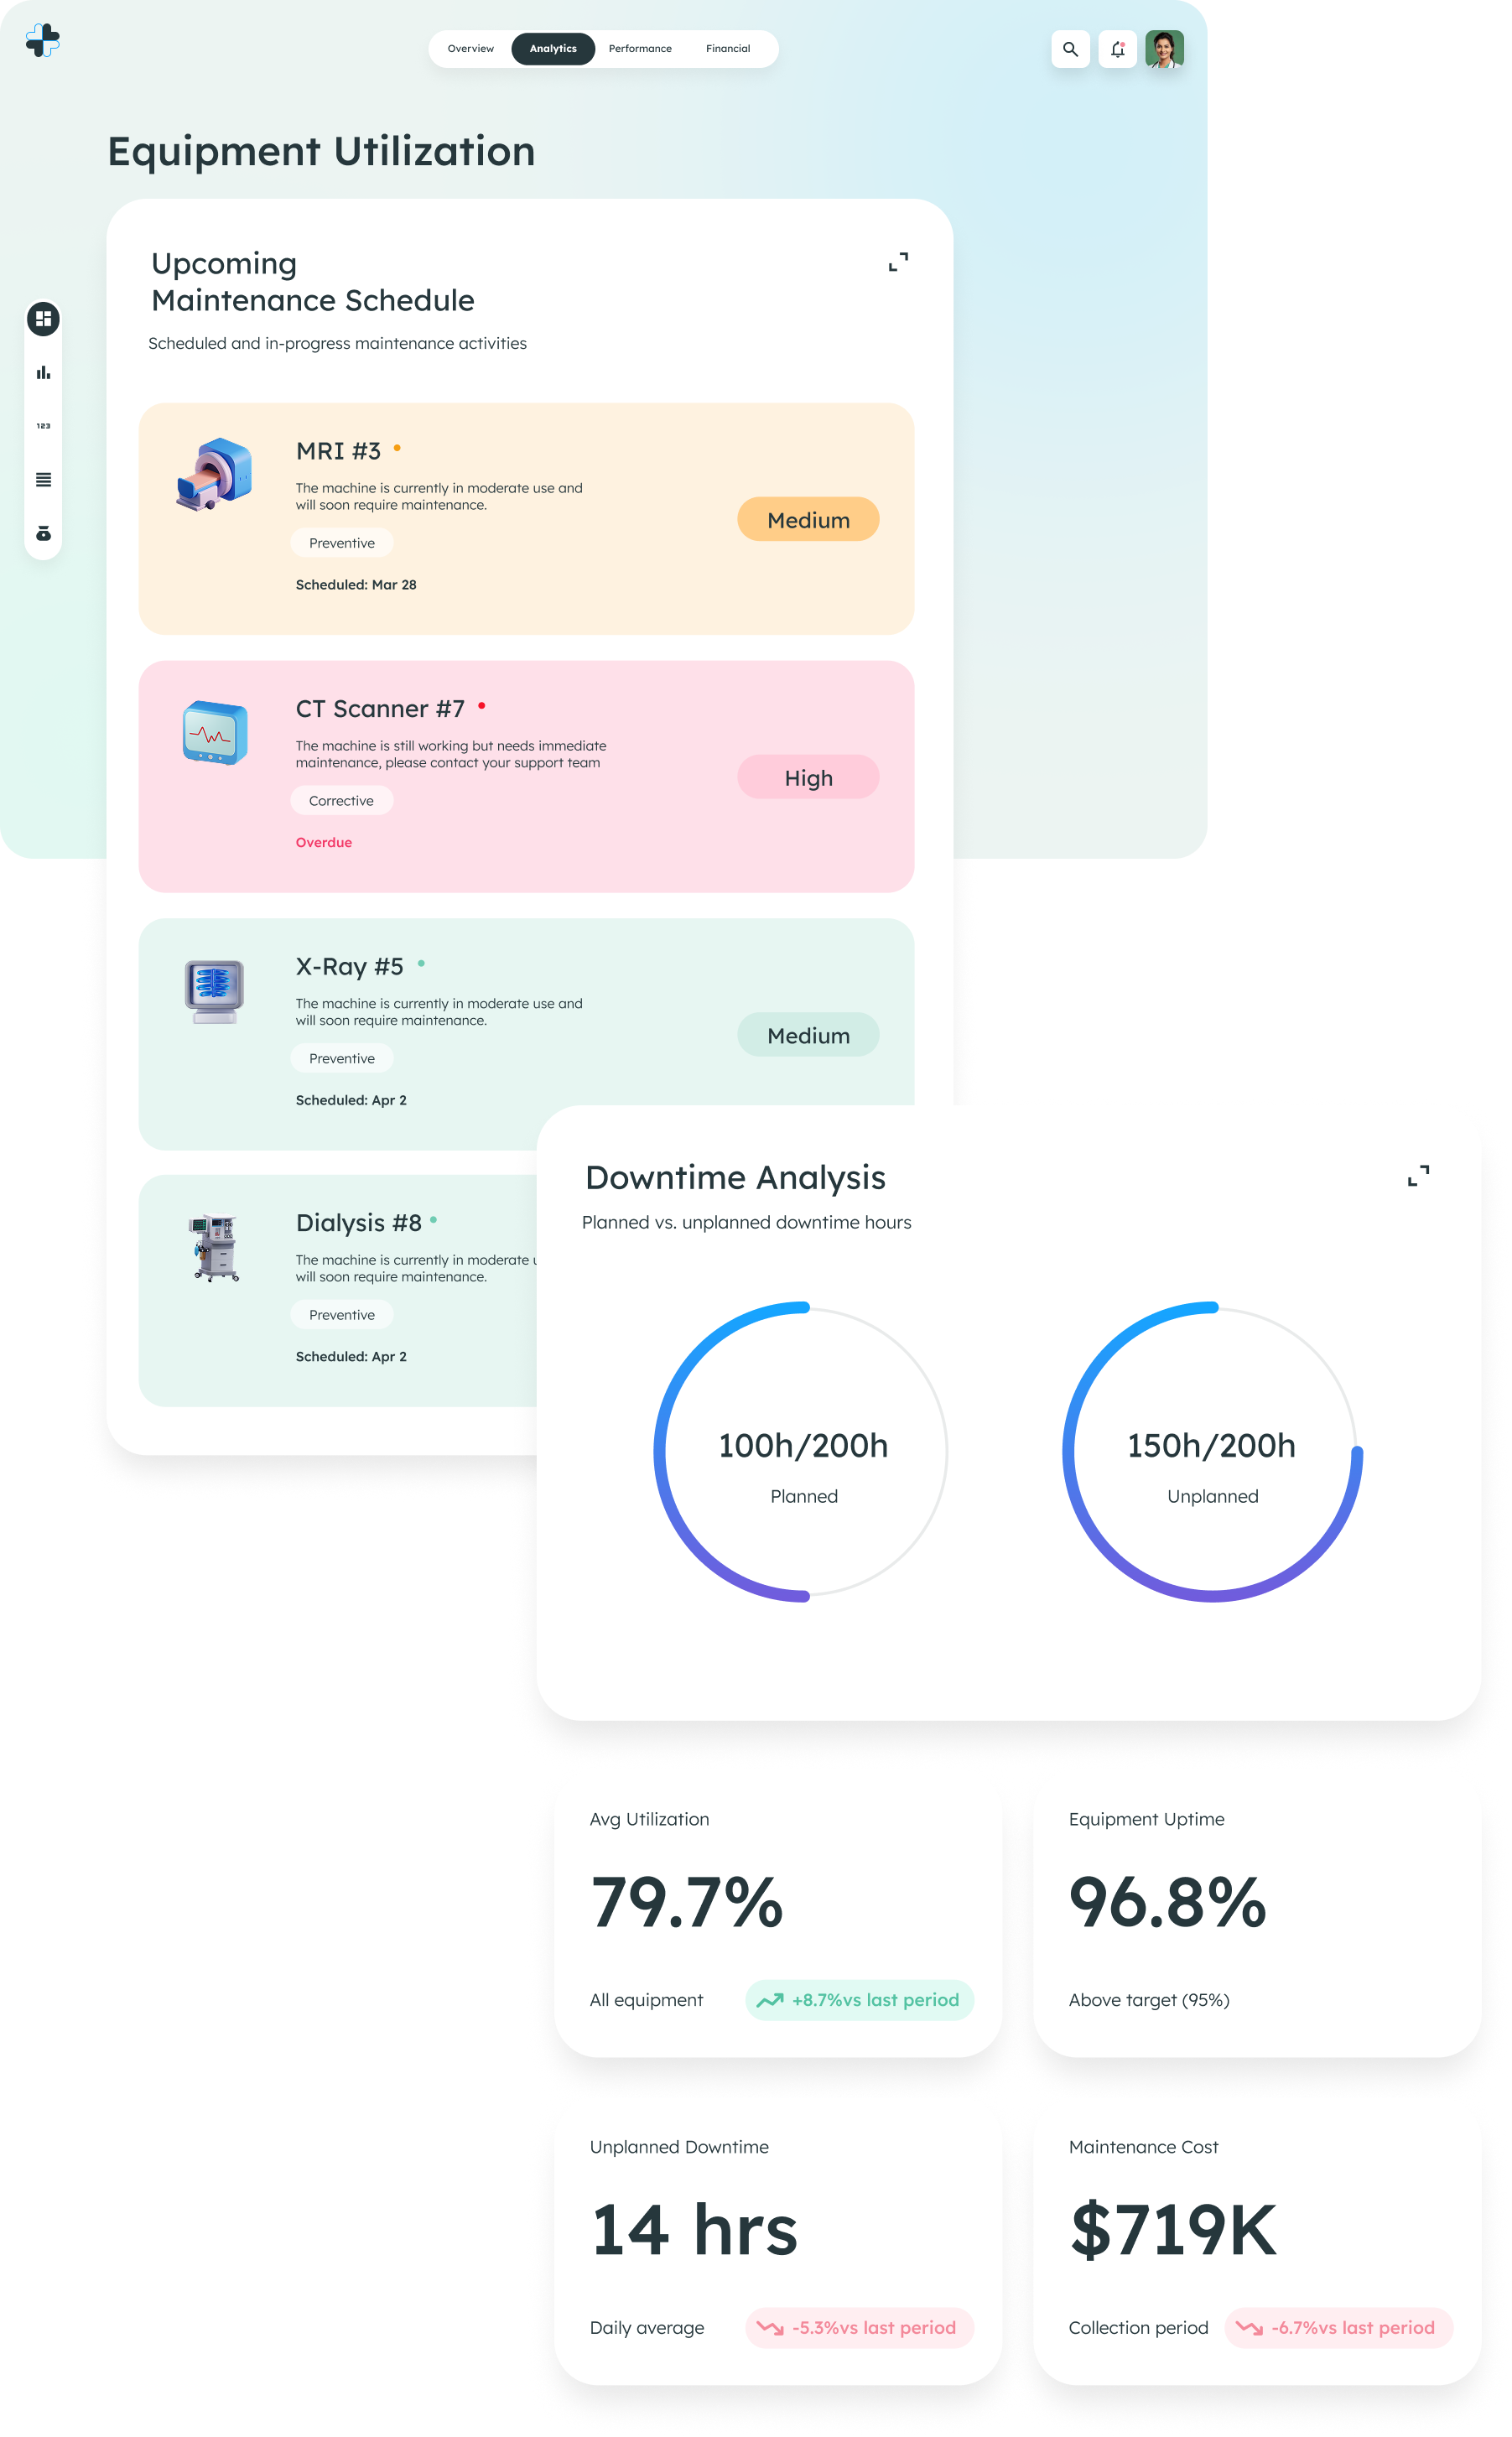
• Medical equipment utilization monitoring
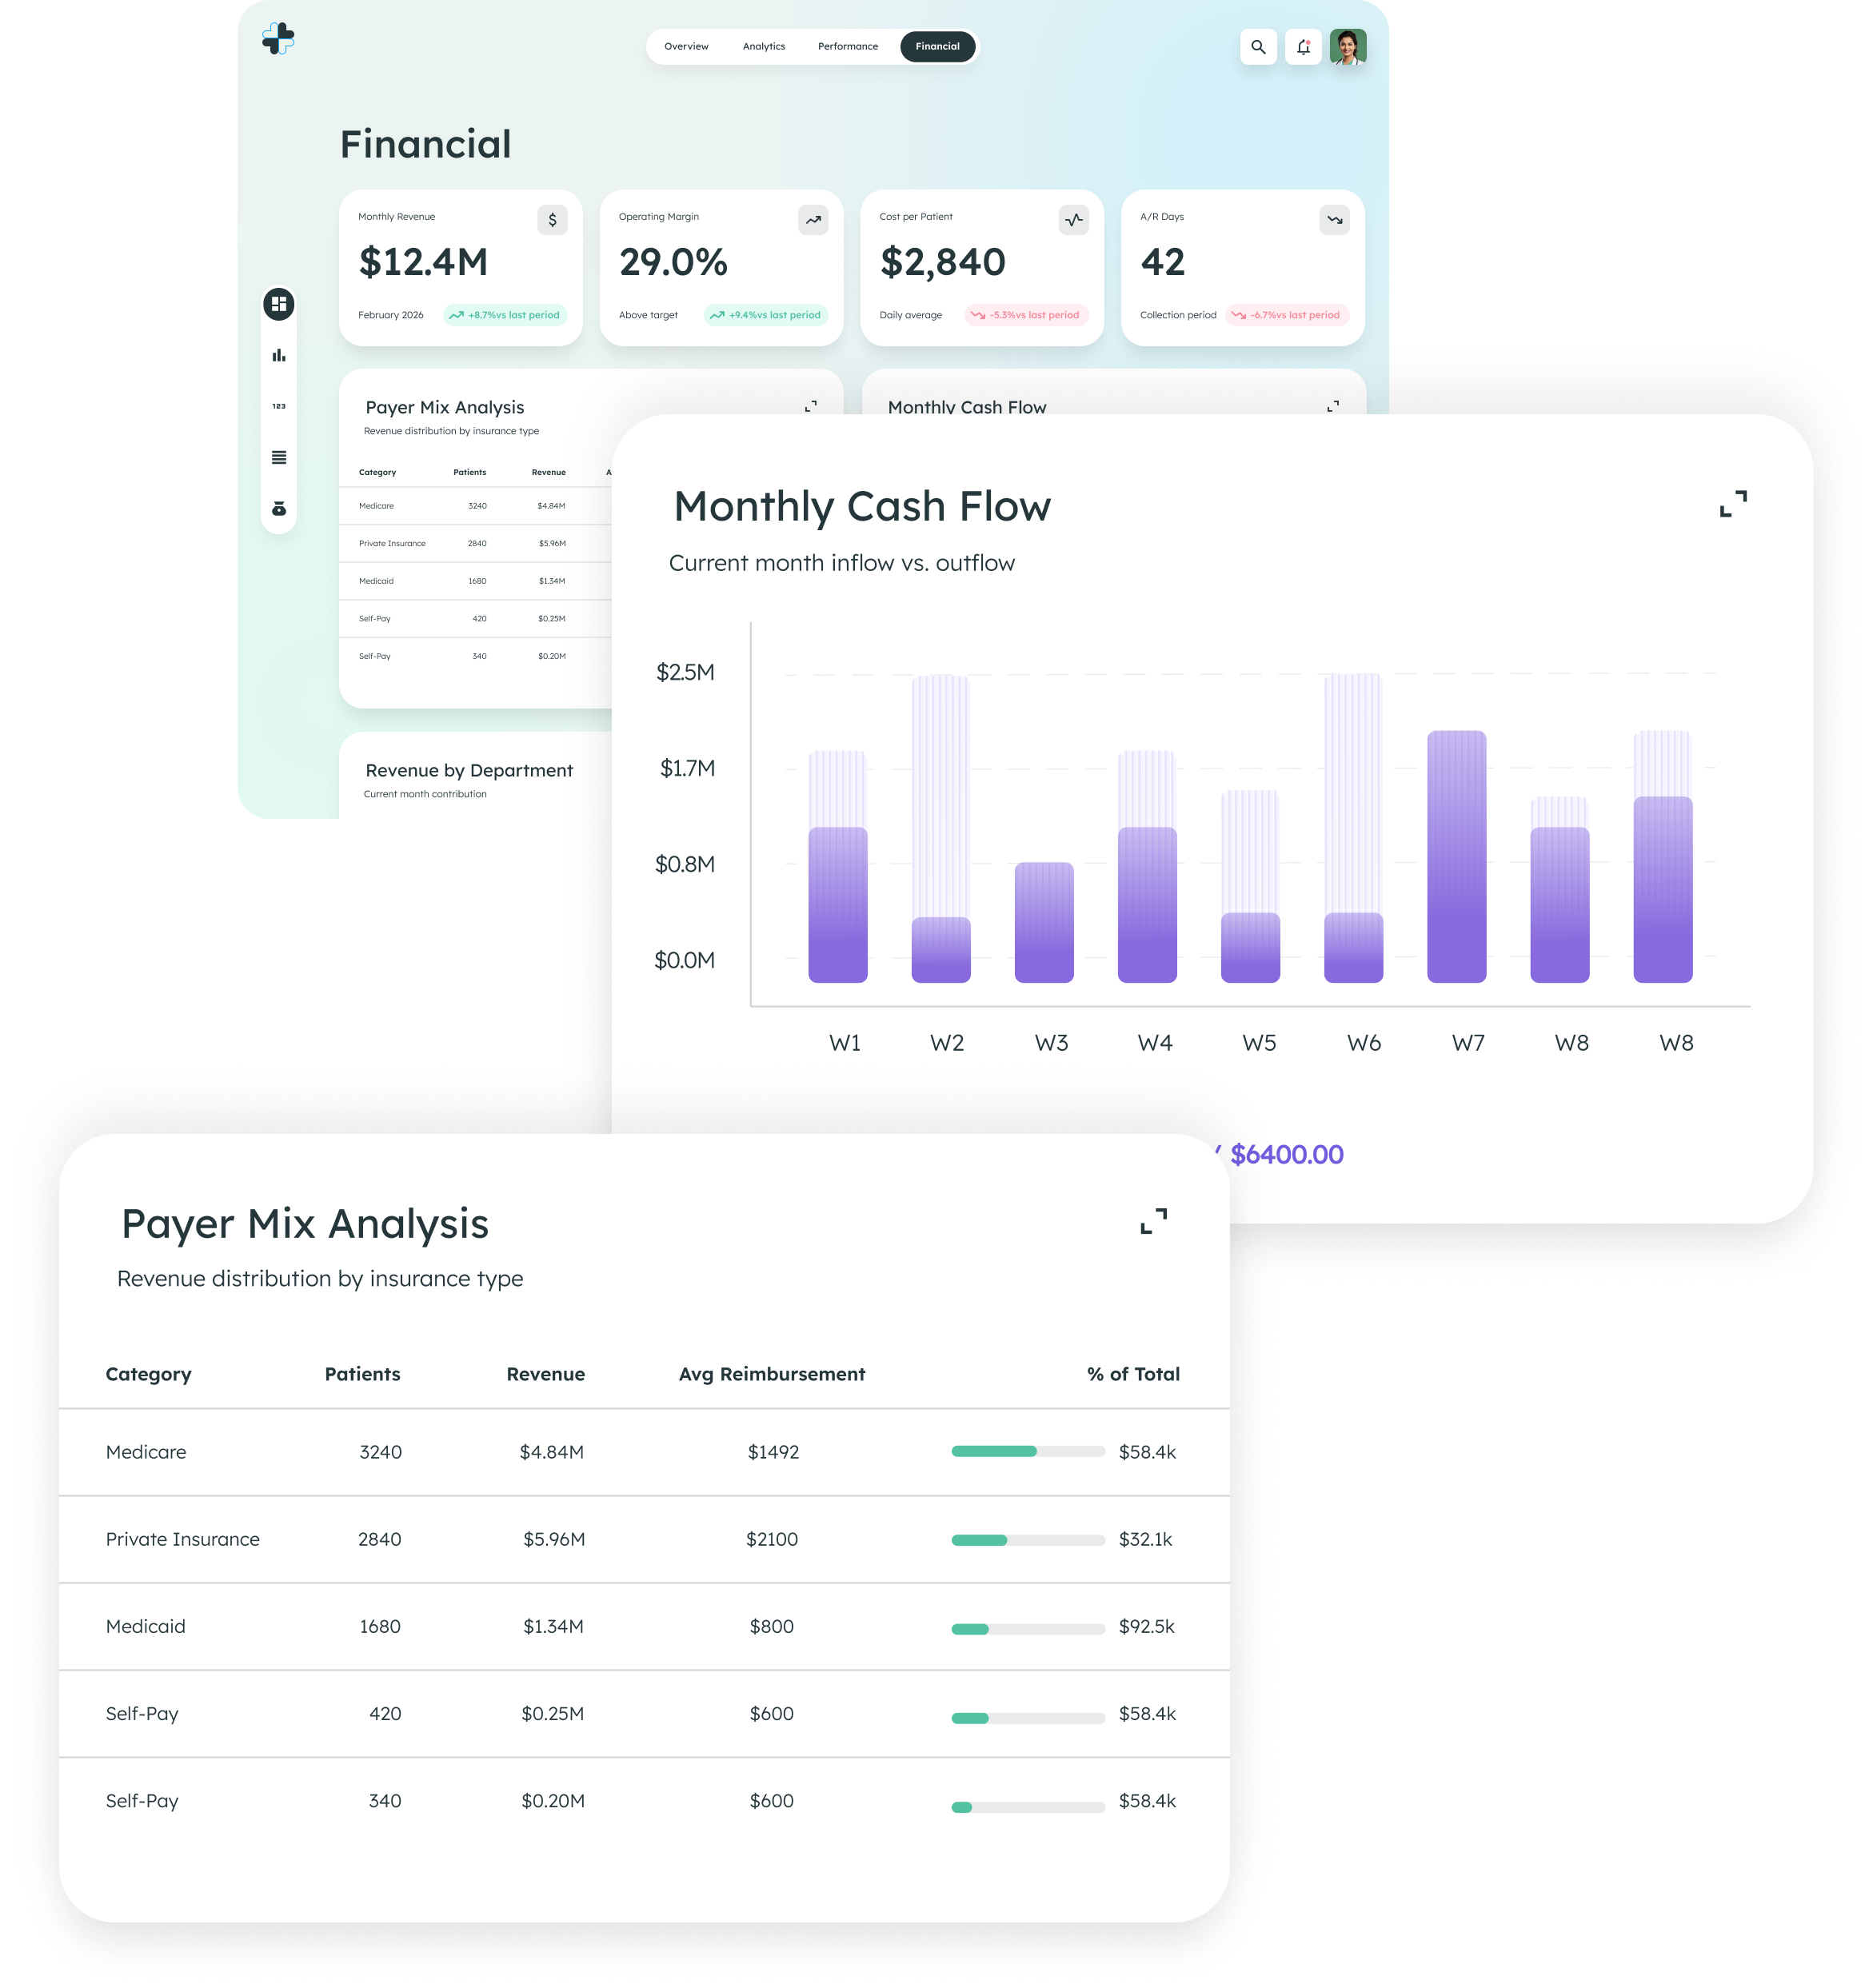
• Financial and operational performance dashboards
The AI focused on macro-level institutional insights rather than individual patient-level medical decisions.
The platform helped healthcare leaders make more informed operational decisions.
• Improved visibility into preventive care performance
• Reduced readmission patterns in targeted departments
• Increased operational efficiency across clinical units
• Identified underutilized medical equipment
• Enabled data-driven executive decision-making
Hospitals operate within one of the most regulated and data-sensitive environments.
The platform required complex system interoperability, strict PHI protection protocols, and transparent AI insights to ensure healthcare administrators could trust and safely use the system.